What if you don’t want to sit around and look at charts all day but still want to make money? You’ve got a few choices:
- Enter buy and sell orders and hope for the best
- Use an automated trading tool that would do pretty much exactly what you’d do
Enter Haasbot. It’s a pretty sophisticated local trading server that connects to many different exchanges via API and allows you to create bots that trade based on a pretty much endless amount of configurations. What’s the catch? It’s not magic; you’ve gotta put in the work to understand how to trade and read charts before you can begin to understand how to configure the bots.
There are a ton of threads on the Haas forums that cover a whole bunch of different topics but there’s not much “fill in the blanks” information available. Here’s where you get lucky though. This idiot sat down and stumbled through it and I’m going to share my successes/failures with you so you’ll have a decent starting point.
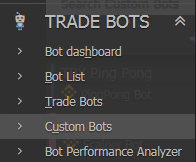
Haasbot allows you to create instances of bots that are largely pre-configured but you can also create your own. The bots that are mostly pre-configured are called Custom Bots. The ones that require more knowledge/configuration are called Trade Bots.
Seems like this first post would be about a Custom Bot, doesn’t it? Nah, we’re gonna go deep. We’re going to do what we’ve learned about Bollinger Bands to create a bot that uses that information to make intelligent trades.
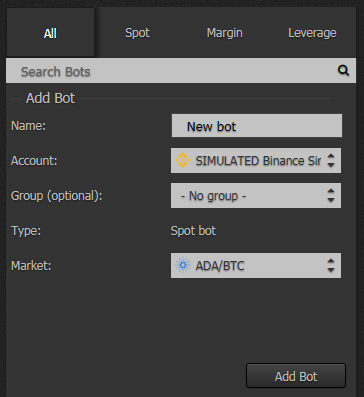
First we have to create a new Trade Bot. Click Trade Bots in the left menu and then click the plus icon to create a new bot. Give it a name that makes sense, pick your API connection, and which pair you’d like to trade. Click Add Bot to continue.
You’ll be presented with the bot configuration page after you click add bot. The tabs to the right from top to bottom are
- General Information
- General Settings (pretty much the same as the new bot dialog)
- Trade Settings
- Safeties
- Indicators
- Insurances
- Schematic
- Lock/Unlock
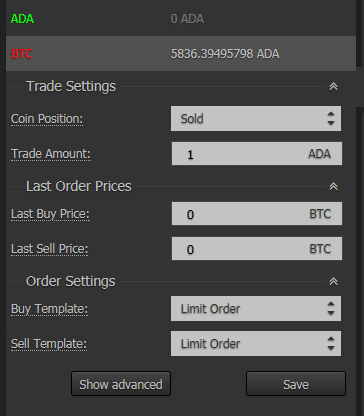
On the Trade Settings screen you’ll see the coin position of the bot:
Sold = I don’t have any but I want some
Bought = I have some I need to sell
The trade amount is how many of the given coin you want to buy and sell. This bot will attempt buy everything and sell everything. This amount needs to be something realistic for the pair you’re trading. Go check the volume in your exchange and look for actual orders. Pick a number that makes sense.
The last order prices will be populated by the bot automatically as it buys and sells.
Here’s where it gets interesting. On the Indicators tab click the plus icon and pick Bollinger Bands and you should see something like this
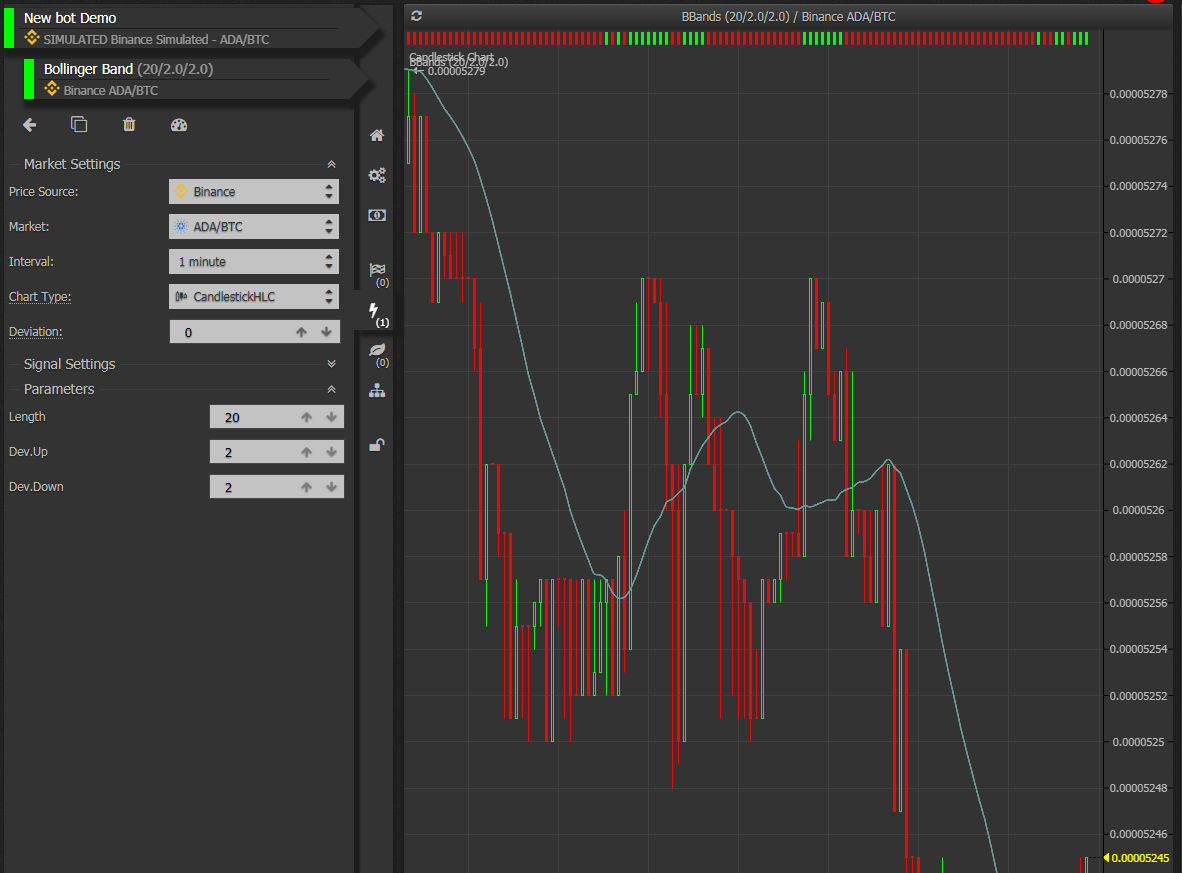
You’ll see the default settings. From top to bottom you’ll see:
- Price Source – the exchange you want to use pricing information for the indicator. This doesn’t have to be the same exchange you’re trading on. If you’ve found another exchange that moves before the one you trade on you could try using it as the price source here.
- Market – the pair you want to indicate on
- Interval – the interval of the chart
- Chart Type – the type of chart to use
- Deviation – the delay between the indicator hitting its point and when it sends the signal. This is a multiplier of the interval; interval of 1 minute and deviation of 5 would mean it would wait 5 minutes before sending the signal
- Length – the number of periods to use to determine the Moving Average; sometimes called the lookback. This number multiplied by the Interval will give you the length of time it’s using to calculate the moving average. If the interval is 1 minute and Length is set to 20 it would consider trades from the last 20 minutes in the average.
- Deviation Up – how far above the moving average you’d like to set the point where the bot should trigger a sell condition
- Deviation Down – how far below the moving average you’d like to set the point where the bot should trigger a buy condition
By manipulating just those last 2 deviation points you could configure your bot to buy when the price dips further below the moving average, potentially for more gain.
As you’re changing the settings watch the graph to the right; especially the red and green bars along the top of the chart. The green ones show where this indicator would emit a buy signal and the red ones show where the indicator would emit a sell signal. These should change in real time with the changes you make to the configuration. Make sure the bot is buying/selling where you think it should and move on to the next step.
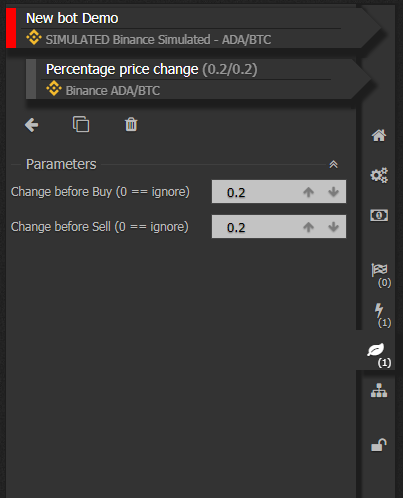
Now let’s make sure you don’t lose money on trades this bot makes. Click the Insurances tab and click the plus icon to add a new insurance. Select Percentage Price Change and add it to your bot.
Change before Buy makes sure that the price has changed the specified percentage after the buy signal is set before the bot will issue a trade.
Change before sell makes sure that the price has changed at least the specified percentage after the sell signal is set before the bot will issue a trade.
For this example we want it to buy immediately when the bottom Bollinger band is hit so change the first parameter to 0. For the sell you’ll want to double the fees for your exchange (trade in + trade out) and then tag on whatever profit you’re looking for. Remember with a bot it’s quantity over quality; the bot can execute logic and trade much faster than a human so it can execute dozens of trades at a partial percentage point in the same time period someone may sit and hold for a 1% gain. The bot comes out ahead 🙂
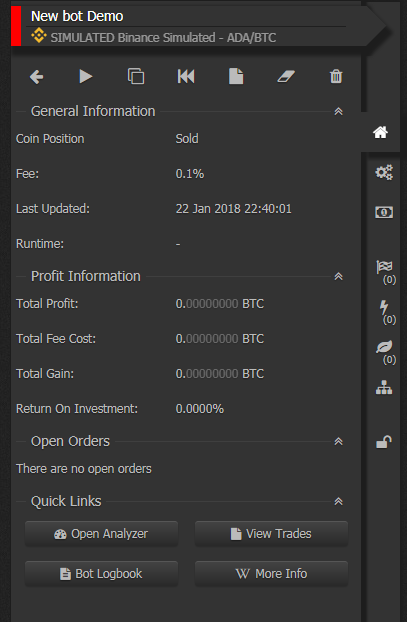
How do we know it will work properly? Glad you asked! If you go back to the General Information tab you’ll see a bunch of buttons across the top
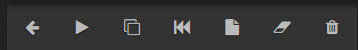
From left to right:
- Back – takes you back to the list of the bots
- Play/Pause – activates/deactivates this bot
- Clone – Clone this bot
- Backtest tool – Execute this bot on historical data
- Order List – Display the orders this bot has placed
- Clear – Clear all of the history for this bot
- Delete – Delete the bot
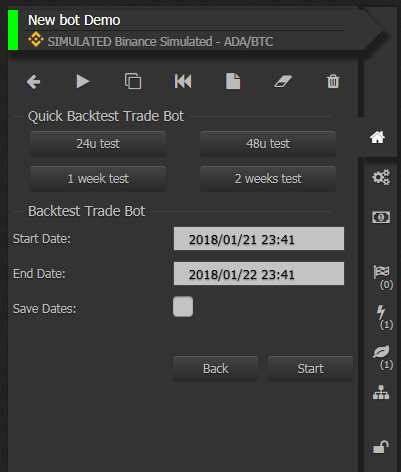
What we’re interested in here is the Backtest tool. This uses data pulled from your exchange’s API and allows you to pretend your bot was active during this time period and it will show you how your bot would’ve performed. There’s a few caveats here; the trade engine assumes that everything would fully fill, it’s not able to have the information about what happened inside of a given period so it only tests against the closing price by default (you can change this if you want)
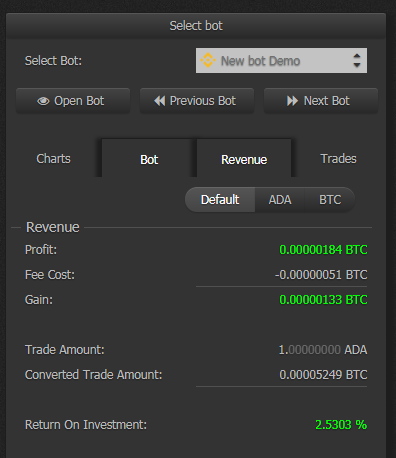
Execute as many back tests as you’d like on whichever periods you’d like and examine the results. Make changes to your bot settings and re-run them to experiment with what impact the different settings have. Below are results for the prior 5ish days at the time of writing. Not too shabby if you ask me.