 Chances are if you’re new or somewhat new to trading you’re not familiar with why the charts everyone posts look kind of … different. What’s going on in the graph? How do I read it? Why are they different colors? Hopefully I can help you decipher some of this.
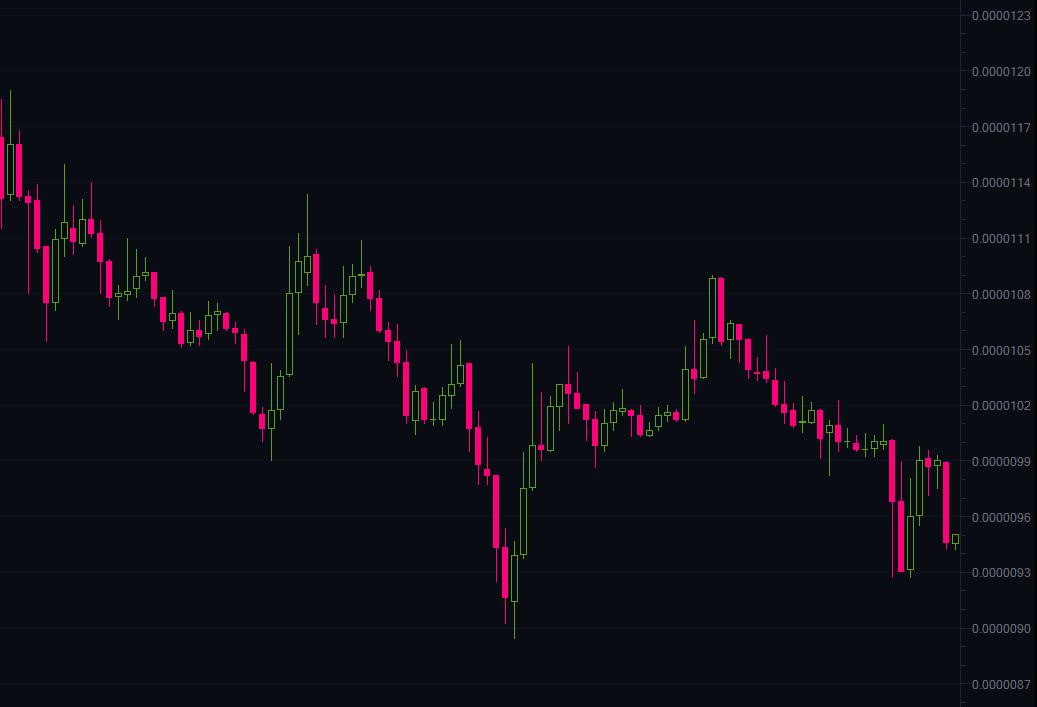
This type of graph uses what are called candles to show movement along the graph during a given time period. They’re usually adjustable in terms of what time period they show. The lower the time period the higher volatility you can see. Raising the time period filters out a lot of the back and forth noise and lets you see a better trend form. The general rule here is the shorter time frame you’re viewing, the faster you need to be able to react when trading. The opposite is also true.
Each candle represents a given time period; the graph above shows 15 minute candles. This means that a candle tells you everything that was done within that 15 minute period, if you know how to read it. Each candle starts off where the last period closed. It’s not really possible to find that exact point once the candle has moved from where it started but that’s how it works. If the price goes up from the start point, the box will grow upward and the candle will be green. If the price goes down from the start point the box will grow downward and the candle will be red. After the end of the time period, the candle stays whatever color it was based on its movement from the start point.
See how some candles have wicks hanging out of one or both ends? What that means is that the price rose/fell to a given point and then pulled back. If the wick comes out of the top of the candle it means that the price rose higher and pulled back some. The longer the wick the harder the pullback. The reverse is true for a wick protruding from the bottom of the candle.
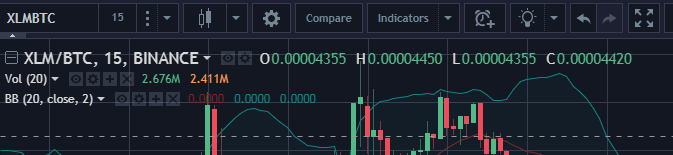
TradingView has a helpful tool. If you hover your crosshair on a given candle’s time frame then it’ll show you at the top left of the graph the Open(O) High(H) Low(L) Close(C). The color of the text will correlate to the color of the candle. When watching trend lines or Bollinger Bands it’s important to only take full candles over/under/touching the lines into consideration.