Where do I start?
If you’re just getting started, it can be confusing to figure out what tools to use and when you find one that a good number of people use, it can be hard to get information about how to use those tools.
Charting Tools
Most exchanges have charts you can view and some of them are pretty decent but Binance has the best ones I’ve seen on any exchange. That being said, their drawing capabilities are limited so I end up using TradingView. All of the screenshots and grabs I’ll be posting in my posts come from TradingView. You can use the site without registering but it won’t save you list of tickers or any drawings you may make so it’s good to register a free account. The paid account allows you to have multiple charts open at one time and allows you to have more alerts, you’re limited to a single active alert at a time on a free account, and also allows for more advanced alerts (SMS, SMS relay via email).
The way TradingView works isn’t really intuitive to newcomers but it’s pretty easy once you figure the basics out. After you create an account and log in you’ll see a search box where you can search by ticker. TradingView supports stocks, FOREX, and cryptocurrencies so there are a whole bunch of different tickers. Enter your desired pair and make sure it’s on the exchange you use.
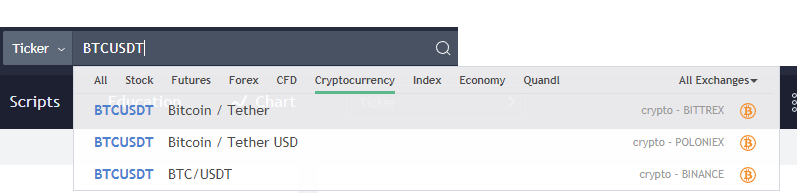 You’ll notice that BTC/USDT is listed on several exchanges. Make sure you select the one you actually intend to trade on.
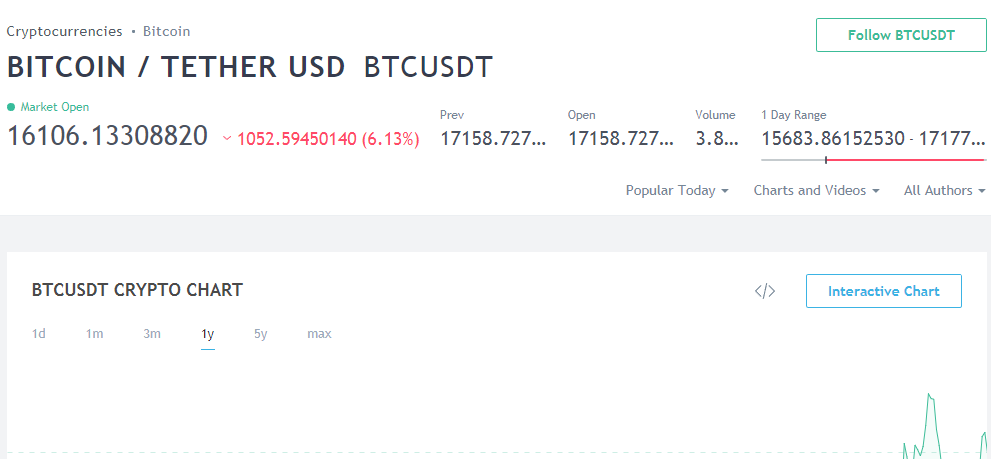
After selecting the pair you’ll be taken to a screen for that pair; not the chart. Kinda counter-intuitive isn’t it? Click the “Interactive Chart” button to get onto the goodness.
You should see something like this, maybe not as many bells and whistles just yet. The chart in this screenshot has Bollinger Bands, volume, and MACD turned on. I’ll go over quickly how you add these.
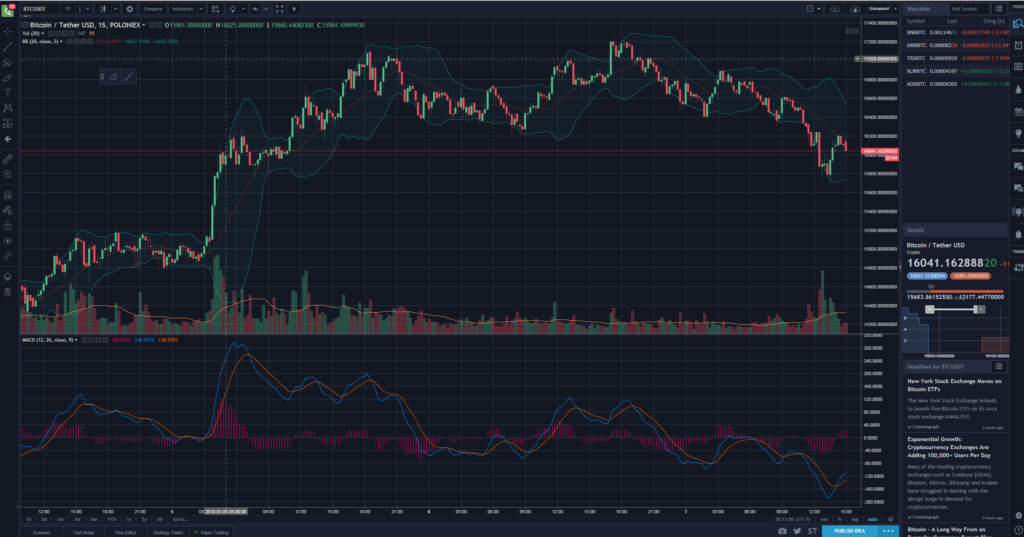
![]()
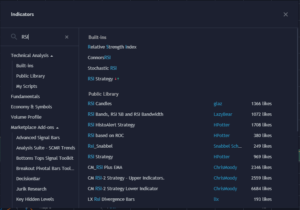
At the top of the screen there’s an indicators button. Clicking it will bring up a menu with a search field; let’s add RSI. Type either RSI or Relative Strength into the search box and you’ll see some results. Click RSI and it will be added to your chart. The free level account is limited as to how many indicators you can add so if you get to where you find yourself needing more indicators, upgrading to a pro account may be good for you.
On the right hand side of the screen there’s a section called Watchlist. Once you’ve got a chart open you can click on any symbols listed and the chart will change. Your indicators will automatically be configured on the other coin. If you want to add a new symbol enter it into the “Add Symbol” box at the top of the section and choose the proper pair and exchange as you did earlier. It will be saved here for future reference.