RSI (Relative Strength Index)
This is a number from 0-100 that gives the relative strength of a given coin as a percentage. The “sweet spot” is 40-70%. Anything above 70% is considered overbought; there have been more buys on the market than the volume of the market can support. This means “don’t buy, you idiot”. Under 40% is considered oversold; there’s been fewer sells on the market than the volume of the market should’ve had. This is usually a good “it’s relatively safe to buy” point.
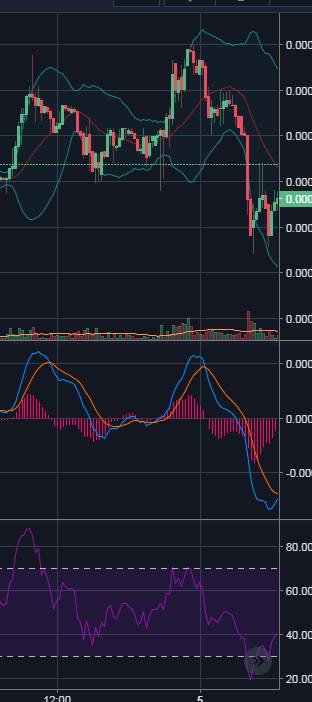
Here you can see the chart with b-bands at the top, MACD in the middle, and the RSI on bottom. You’ll see the coin had a pretty big red candle (thanks BTC) and then some waves since then. MACD is still indicating a good time to buy with a previously strong buy indicator. At the bottom you’ll see the RSI. TradingView defaults this to 30-70% but I rein it in so it keeps me out of trouble. This coin is currently at 40%.
Combine all the indicators:
B-bands say it’s coming off the bottom band testing the middle band for a second time
MACD says it’s still a good time to buy, lines haven’t crossed yet
RSI says it’s neither oversold nor overbought
All this adds up to “this is probably a safe buy”