When I first started using Haasbot I did a whole lot of random number entry and backtesting. There’s nothing wrong with that but I had pretty much zero idea on what was a reasonable starting point for a given indicator or setting. One day while randomly clicking around I decided to check out what everything in the side menu was and ended up clicking Indicator Scanner (cue angelic chorus).

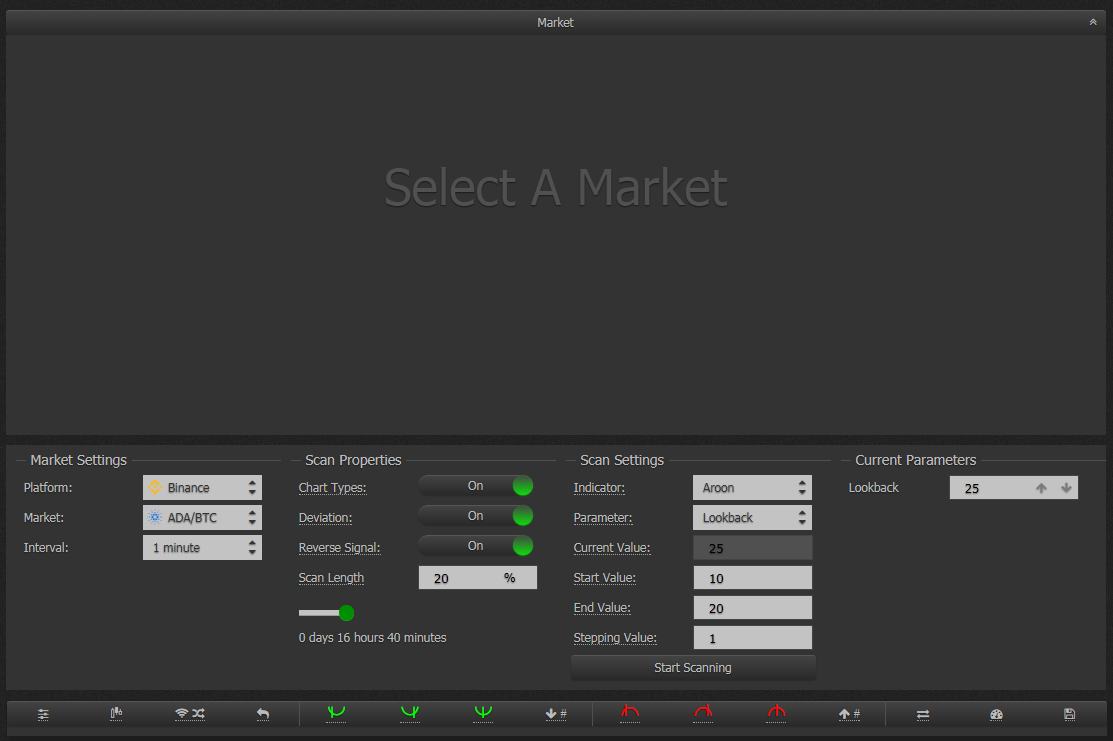
What this wonderful piece of functionality lets you do is pick a market, choose how far back you want to scan data, choose your indicator and then pick one of that indicators parameters. In the picture above it’s using the Aroon indicator and the Loopback parameter. It will display the current value (depending on how you got to this screen, it may be populated in a different way; more on that later). Below that you’ll see Start Value, End Value, and Stepping Value. Start Value is the low end value you’d like the scanner to use. End Value is the highest value you’d like the scanner to use. Stepping Value is a number that will be added to the start value repeatedly until it ends up at the end value. If you click Start Scanning it’ll go back in time (Doc Brown) the amount of time listed to the left in scan properties and it’ll analyze that particular indicator and come up with the best guess value for the selected parameter. Confused? Don’t be!
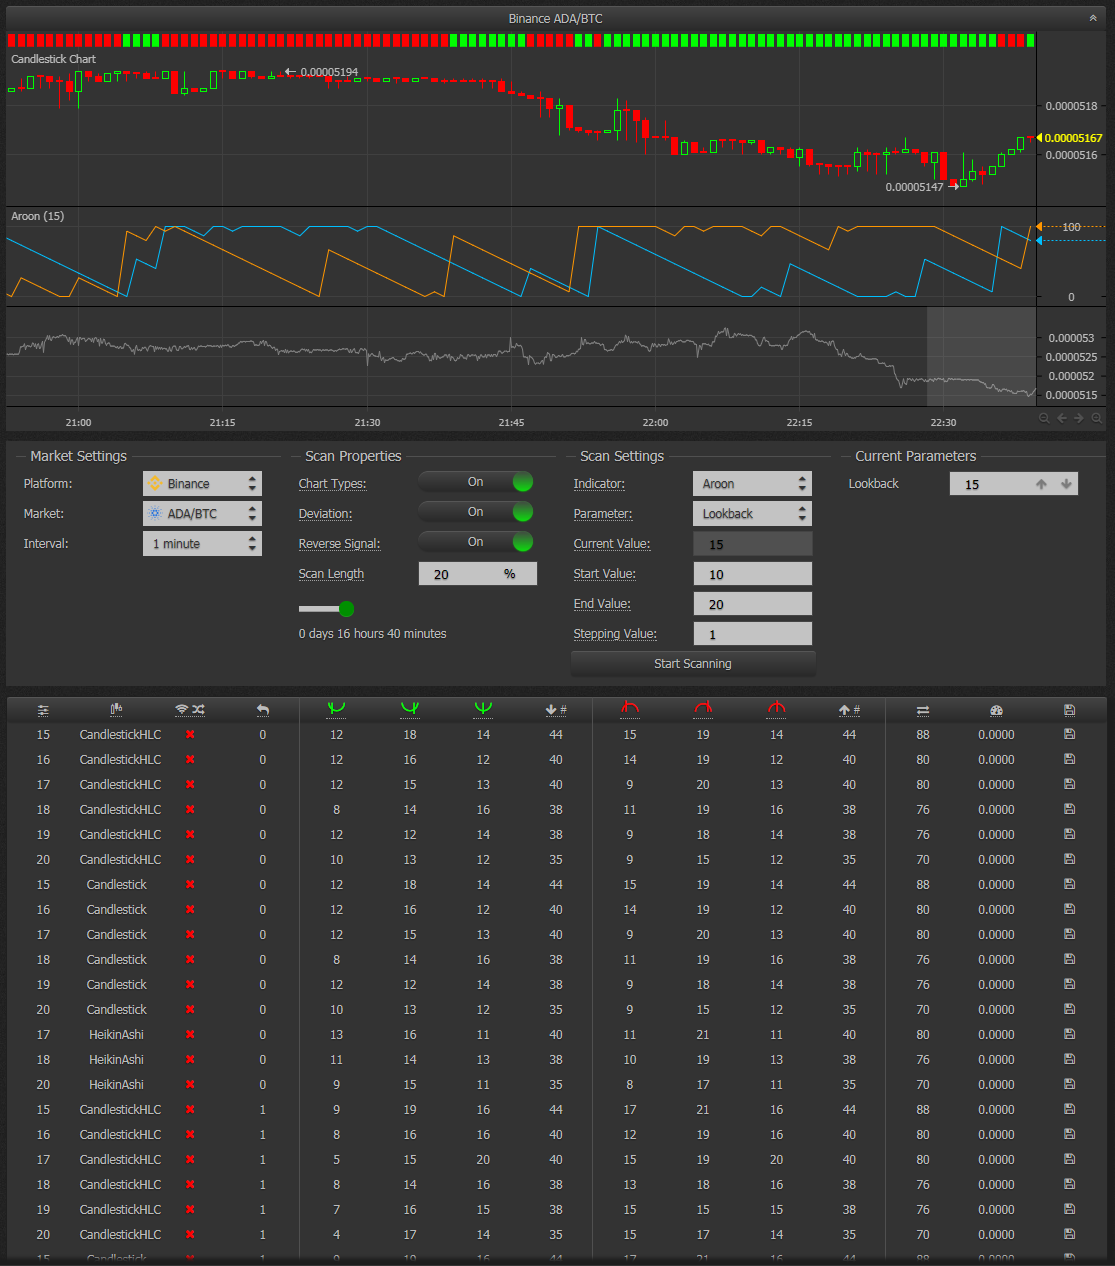
After running a scan you’ll see a table of data the scanner found while running through the prior data and you’ll notice the graph at the change has been populated (if it wasn’t before) and there are buy/sell blocks at the top of it. If you don’t see the table at the bottom due to your screen resolution you can click the accordion collapse in the top-right corner.
But what does it mean? The trade engine loops through values from Start Value to End Value and checks against the history of the selected pair and tries to come up with the best setting it can. It’ll try different chart types, deviations buy, and sell settings to figure out what would’ve been the best setting during the given time period. What’s most important to note here is that this shouldn’t be taken as an absolute truth but more of a starting point. You can combine these indicator settings with others and see how they play together. It makes the whole process less like putting a wild guess into a configuration text box and going for it.
Remember earlier when I said “depending on how you get here”? You can actually get to this feature from inside most bots. It’s a little tricky because the trade analyzer and the indicator scanner use the same icon so it’s not readily apparent that’s what’s going on. Inside any Indicator in a trade bot you can click the little gauge icon and you’ll be taken to the indicator scanner. Sometimes the indicator settings from inside the bot will carry over to the scanner. Make sure you take a note of what the values are currently before using the scanner. Once you find some settings you’d like to use in the scanner’s results table you can click the save icon on the far right column and you’ll be taken back to your bot’s configuration.
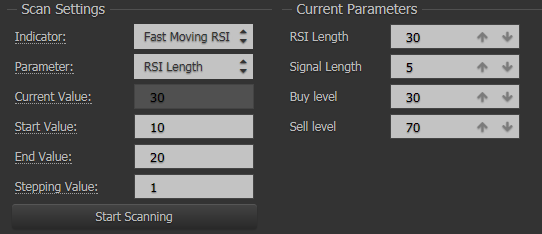
For indicators that have a length parameter, the scanner usually works best if you set this property first and then adjust the others afterward; fast RSI has 4 settings that are used in the indicator. After you get your ballpark figures go back into the chart for your indicator and check what modifying them does to the buy/sell points marked on the chart. Tweak these until you can get your indicator giving reliable signals.
.
I am not associated with Haasonline. The opinions and analyses contained within this page are my own and should not be taken as advice expressed or implied. Trading involves risk including total loss of investment; make sure you only risk what you are able to lose.
I am not associated with Haasonline. The opinions and analyses contained within this page are my own and should not be taken as advice expressed or implied. Trading involves risk including total loss of investment; make sure you only risk what you are able to lose.
